Understanding Log Monitoring Tools
Every alert, error, and transaction in your system generates a log.
Logs are the behind-the-scenes MVPs. They’re packed with insights that keep your apps running, your systems secure, and your team ahead of the curve. It’s about analyzing logs in real time to identify anomalies, track performance, and troubleshoot efficiently. Efficient log monitoring means catching problems early, staying secure, and running your applications without a hitch.
In this guide, we’re highlighting the top log monitoring tools for 2025. These tools are designed to help your team troubleshoot efficiently, keep things running smoothly, and boost performance. Let’s jump in ⬇️
What is Log Monitoring?
Logs are generated whenever your applications, servers, or infrastructure perform an action. These detailed records capture events, errors, and performance data, among other aspects offering a behind-the-scenes view of how your applications are operating.
Logs are like your system’s memory. They often record every event with precise timestamps, allowing you to understand how your systems function. Log monitoring helps you identify unusual patterns, prioritize key problem areas, and fix issues faster. For instance, it allows you to trace the cause of a failed transaction, uncover potential security risks, or address performance slowdowns before they escalate.
The value of log monitoring lies in its ability to save time and reduce the guesswork when issues arise. Instead of spending hours trying to figure out what went wrong, logs guide you straight to the problem. Whether it is a database error, unexpected traffic spikes, or a network issue, having this visibility enables teams to act swiftly, minimize downtime, and keep operations running smoothly.
These days even a minor disruption can be expensive, hence, log monitoring is as essential as logging.
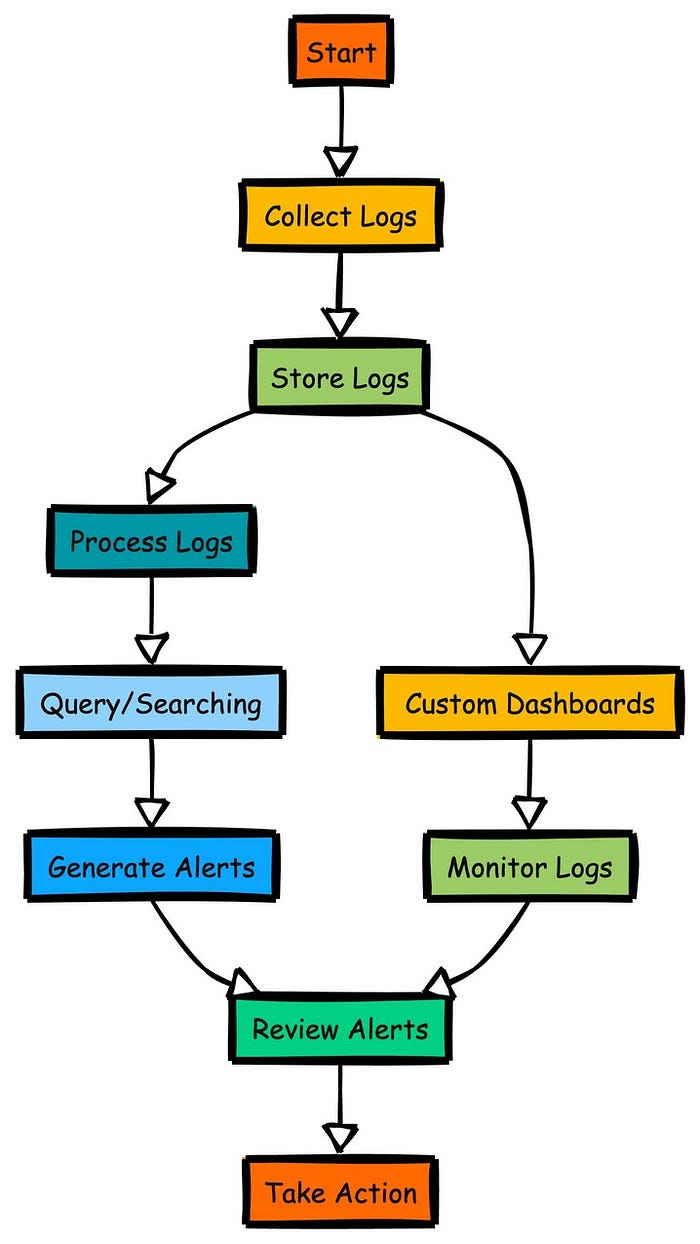
Here is a simple explanation of how log monitoring works:
What are Log Management Tools?
Log management tools help collect and organize logs generated by your systems. These tools make it easier to track and understand what’s happening across your systems.
By analyzing logs as they come in, these tools help teams catch problems early and fix them faster. When an application slows down or an error occurs, clear insights from logs make it easier to respond quickly.
There are many log management tools available today, each tailored to different needs. Many of these tools include helpful features like simple search functions, instant alerts, and flexible dashboards that adapt to the way your team works.
Why are Log Monitoring tools important?
Log monitoring tools are essential for keeping your applications and systems healthy. Logs are generated to record the details whenever there is an error or a problem. Log monitoring tools automate this entire process, making it easy to identify problems and resolve them quickly.
Here are the main aspects that exhibit the advantages of log monitoring tools:
- Early discovery of the problems, odd actions, and likely threats
- Rapid and improved troubleshooting
- Enhanced security
- Proactive alerts
- Custom and unified dashboards
- Insights for optimizing performance
- Centralized log management
Top log monitoring tools
1. DataDog
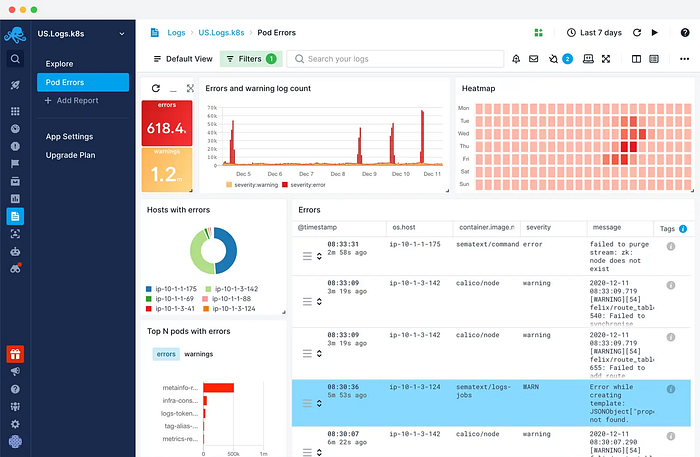
Datadog is a robust, cloud-based monitoring and log management tool that enables us to monitor application and system status along with logs. It serves as an all-in-one platform for log management, application performance monitoring, and security.
Datadog allows us to collect, process, and monitor application and infrastructure logs without limitations. It also provides a Cloud SIEM to detect security threats within our environments, and notably, it doesn’t require us to index those logs.
Datadog can be integrated with any third-party tool, making log management straightforward without requiring knowledge of a specific query language. With unified tagging, filtering, and searching become simple and efficient. We can also create intuitive dashboards and set up alerts to detect and resolve issues proactively, preventing them from impacting end users.
2. Sematext Logs
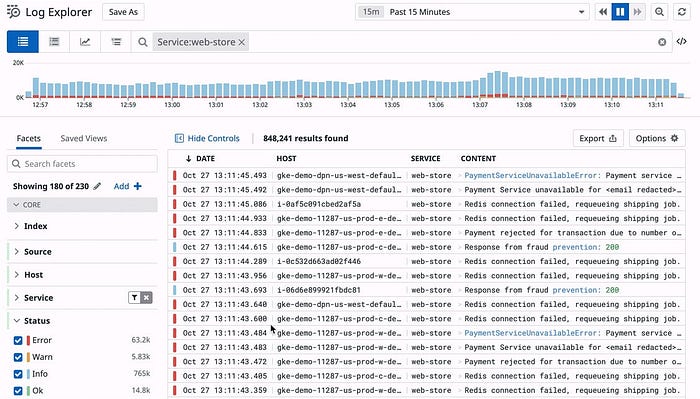
Sematext Logs is a cloud-based log management and monitoring tool designed for collecting and analyzing application and network logs. It streamlines log monitoring, making it easy and efficient for businesses of all sizes.
Beyond log management, Sematext also offers hosted Elasticsearch, Logstash, and Kibana (ELK) as a service, allowing us to leverage the full benefits of the ELK stack without the overhead of managing it. Sematext simplifies troubleshooting with real-time alerting on logs, enhances application security, and provides powerful search and filtering capabilities.
3. BetterStack
BetterStack is a modern log management and monitoring platform that delivers fast and reliable insights into system performance and application stability.
BetterStack’s speed and simplicity set it apart. It enables faster log querying than many other tools, with no cold storage restrictions, allowing logs to be searched at any time. BetterStack structures data for seamless searching and provides flexible anomaly detection and pre-built dashboards.
What distinguishes BetterStack from other tools is its value, even at the free tier. This tool provides a robust and reliable solution without immediate costs, making it an excellent choice for budget-conscious teams.

4. Dynatrace
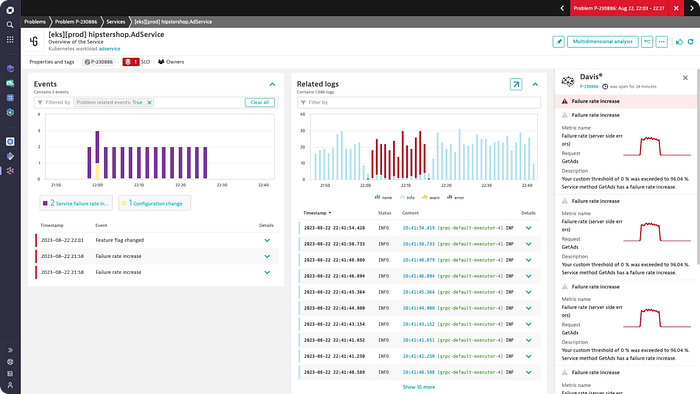
Dynatrace is an advanced application performance management tool that provides solutions for monitoring system and infrastructure logs. It’s a full-stack observability tool.
Dynatrace uses AI to provide automated anomaly detection, log analysis, and root cause analysis, making it easier to detect and resolve issues. It also has powerful search and filtering capabilities, many third-party tools, and cloud integrations.
5. New Relic
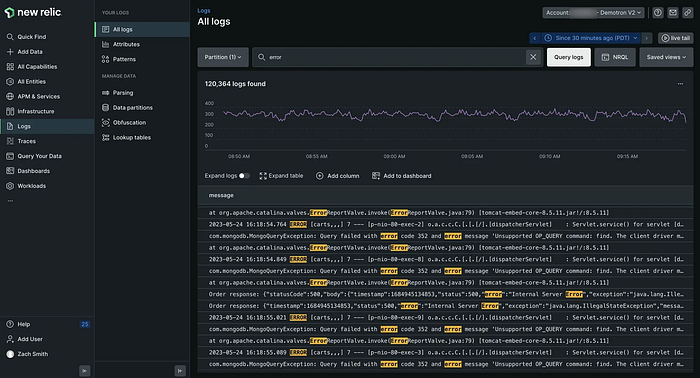
The main benefit of New Relic is its all-inclusive observability suite, which unifies log management, infrastructure monitoring, and APM into a single platform. This integration allows for comprehensive insights into system health and performance. Its anomaly detection and AI-driven insights support proactive problem identification and resolution.
6. Logic Monitor
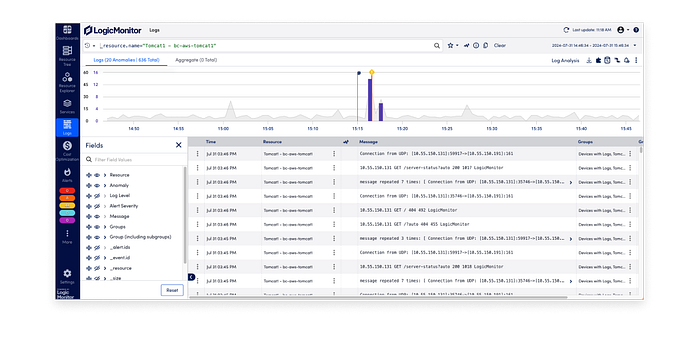
LogicMonitor is a cloud-based monitoring platform that provides real-time application and network logs monitoring. It allows us to analyze logs with performance metrics.
LogicMonitor collects and analyzes log data from various sources, allowing users to identify and resolve performance issues quickly. It also provides AI-guided troubleshooting support, allowing users to analyze and resolve log data without complex queries.
It provides flexible retention and hot storage for our logs. We can choose different plans according to our business needs and leverage 3000+ integrations with third-party tools provided by LogicMonitor.
How to choose log monitoring tools
With so many log management and monitoring tools, finding the right one can feel overwhelming. The key is to choose a tool that aligns with your organization’s specific needs and the requirements of your projects.
Different scenarios may call for different log monitoring capabilities, so here are a few essential factors to consider when selecting the best tool for your needs:
Privacy and Compliance
Data privacy and compliance with all IT regulations are critical. We must ensure that our chosen tool complies with all industry and IT regulations.
If our application handles sensitive and private data, such as customer information, the tool should offer data encryption and appropriate policies. The tool must support SSL encryption for data in transit. Different levels of access should be available within the team to access the logs; hence, Role-Based Access Control (RBAC) is also essential.
Log volume and Retention
We should consider how much log data our systems generate and how long we need to store it. The total monthly log volume should be one criterion when choosing plans. It’s also essential to determine whether you need live tailing and real-time debugging, whether logs must be retained for compliance, and the desired data retention duration.
Choose a tool that can handle large volumes of logs without slowing down and offers flexible retention policies to suit your data storage requirements.
Cost and Scalability
Cost plays a significant role in decision-making. A pay-per-gig approach offers adaptability and intelligent utilization of a logging platform. Depending on your product, your log processing might shift from a few thousand logs daily to millions overnight. Use this checklist to calculate operating costs and identify desired features from a log management platform.
Look for a tool that fits your budget but can also scale as your business grows. Some tools charge based on log volume, so ensure it can handle increased log data without dramatically increasing costs.
User Search Experience
We should consider the ease, speed, and proficiency of the tool’s search mechanism.
The search syntax should be simple and not bound to any specific language. This will make it easier for teams since no additional training is required. Additional features that enhance the search experience, such as autocomplete, auto suggest, time-based filters, and field-based filters, are also highly valuable.
Advance Analytics
The monitoring tool should provide AI and machine-learning capabilities. Features like anomaly detection help teams find issues and unusual patterns in the logs, streamlining the monitoring by detecting issues early. So, those analytics features are what we can look for while choosing a tool.
Beyond Logs: The Importance Of Error Monitoring
Log monitoring offers a lot of valuable insights, but combing through every single log whenever something happens isn’t realistic. This becomes an even bigger problem for small engineering teams, where too much time spent on log reviews can hurt productivity and add unnecessary strain to an already heavy workload.
This is where error monitoring becomes the go-to solution. Unlike general log monitoring, error monitoring zeroes in on actual issues, making it easy to identify and fix bugs faster and easier. It captures specific details, such as error types, timestamps, user actions leading up to the error, and the system’s state when the issue occurred.
For example, if users start reporting crashes in your application, searching through endless logs to find the cause would be time-consuming. Effective error monitoring can bypass this lengthy process. Instead, you receive instant notifications with key information about the source of the crash and other relevant details, giving you immediate insight and enabling a quick resolution.
Why Error Monitoring?
In a world driven by apps, user experience is everything. One glitch, and users may move on to other options. That’s why error monitoring has become essential. For companies wanting to stay on top of issues and fix them before a large set of users are impacted, error monitoring is a game-changer.
Let’s break down one of the top error-monitoring solutions and its key features:
Vigil
Vigil is a one-stop application monitoring tool for Full stack applications, Salesforce Orgs, and Mulesoft applications. It entails features such as API monitoring, job monitoring, application uptime checks, error/exception monitoring, incident management, and escalations to help dev teams gain an in-depth awareness of their applications’ health. And is very easy to set up and use.
Vigil is a go-to solution for teams and organizations that need a simple yet powerful error monitoring tool. Let’s talk about some key features of Vigil in detail:
Key features
Error Monitoring and Grouping
Vigil’s error and exception management provides comprehensive insight into issues across Full Stack applications, Salesforce Orgs, and Mulesoft integrations. It captures detailed information about errors/exceptions, including:
- Stack Trace: Provides a full trace of where the error occurred, helping developers pinpoint the issue down to the file and line in code.
- Error/Exception Message: Displays the exact message of the error/exception, allowing for clear understanding of the issue.
- Tags and Context: Helps categorize and contextualize errors, aiding teams in filtering and prioritizing issues efficiently.
- Reported Date, Client Version, Severity, and Status: Tracks when an error was reported, the client version affected, its severity, and the current status which is essential for prioritizing responses.
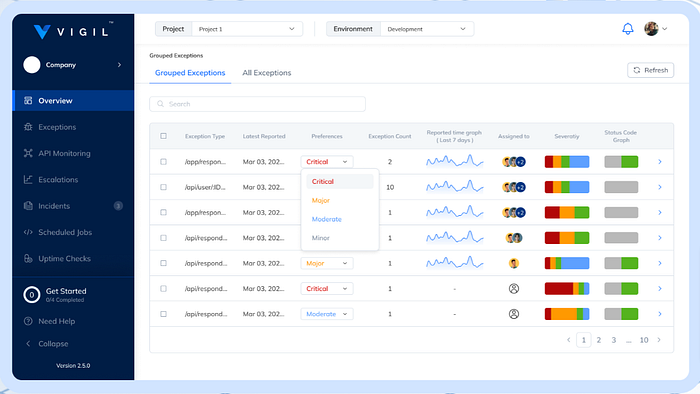
Beyond simple error capture, Vigil enhances the efficiency of error handling by grouping errors and exceptions based on type. This powerful grouping functionality gives development teams key insights into error count, patterns, and frequency, empowering them to prioritize and address issues more effectively to optimize application performance. Vigil’s grouping and overview features include:
- First Reported On: Displays the exact date an error or exception first appeared, helping teams understand the origins of issues and potentially link them to recent code changes or deployments.
- Last Reported On: Shows the most recent occurrence date of the error/exception, providing insight into whether issues are ongoing or have ceased.
- Maximum Reported in a Day: Calculates the peak number of occurrences within a day.
- Trend Graph: Offers a visual trend of error occurrences over time, allowing teams to easily spot patterns and spikes, which is crucial for detecting systemic issues and evaluating the effectiveness of bug fixes.
- Exception Message Donut Graph: This visual summary represents the frequency distribution of specific exception messages within each error type. It enables teams to identify the most common messages quickly, making it easy to prioritize recurring issues.
Additional features:
- Uptime Checks
Vigil checks your application’s uptime 24/7, which is crucial to monitoring. It runs system checkups regularly and creates a full report that includes all the information and graphs about our application and system health. It also sends alerts with intuitive icons highlighting potential problems to avoid downtime.
- Auditing Feature
Vigil enables users to track the availability and uptime of their websites with customizable monitoring options, offering a comprehensive solution to ensure uninterrupted access to online resources. This feature includes selecting log frequency, specifying authentication details, adding custom headers, and configuring notification settings, helping teams stay informed about website performance in real-time.
- API Monitoring
Vigil provides real-time analytics on API performance, capturing metrics such as response times, failure rates, and throughput.
Conclusion
This guide explored why log monitoring and management are crucial for businesses today, along with some of the top tools and their key features.
Applications produce huge amounts of log data every day, so manually analyzing them is simply not possible. Log monitoring tools effectively facilitate the different teams’ obtaining relevant conclusions from these logs. Error monitoring tools go even further, allowing rapid analysis of critical problems, which in turn enables teams to resolve incidents quickly and maintain the application’s security.
As time and regulations evolve, log and error monitoring becomes even more critical. The presence of real-time alerts, visual dashboards, and machine learning improves the ability to diagnose and avoid issues or escalations that can occur. Log and error monitoring are the backbone of proactive IT management for organizations of all sizes.
FAQs
- Why should you invest in log monitoring?
Protecting your application systems and infrastructure is what will keep the business going. Getting a log monitoring solution will bring to the teams’ attention the occurrences of events, errors, and probable problems with your applications and infrastructure. It guarantees that you detect issues early, adds security by detecting odd activities, and maintains system performance, saving time and reducing downtime.
2. What should you look for when choosing log monitoring tools?
When selecting a log monitoring tool, you need to check out its functionalities, such as real-time alerts, easy searching, filtering options, and the means of adding it to your other systems. In addition, see if it includes a user-friendly dashboard that lets you visualize data, can work with several log sources, and offers security features such as anomaly detection.
3. What are some log monitoring best practices?
One of the best ways to set up real-time alerts for critical errors is to regularly review logs to spot patterns and filter out unnecessary data to focus on what’s important. Additionally, centralizing your logs from all systems into one place is essential, and your team must know how to search, interpret, and act on the data.
4. What are common log management use cases?
Log management is used to find and fix application and system problems, check for security threats, improve performance and stability, record user activities, and ensure compliance with regulations.
5. What’s the difference between log monitoring and log analytics?
Log monitoring involves real-time tracking and monitoring logs to catch probable issues. Log analytics involves observing data patterns and providing more context so teams can follow best practices.
Visit the website for more details https://www.vigilnow.com/
